Author
Ye Xue, PhD candidate in Electrical Engineering and Computer Science, Northwestern University
[email protected]
Background
Patients who are readmitted to an intensive care unit (ICU) usually have a high risk of mortality and an increased length of stay. ICU readmission risk prediction may help physicians to re-evaluate the patient’s physical conditions before patients are discharged and avoid preventable readmissions. ICU readmission prediction models are often built based on physiological variables. Intuitively, snapshot measurements, especially the last measurements, are effective predictors that are widely used by researchers. However, methods that only use snapshot measurements neglect predictive information contained in the trends of physiological and medication variables. Mean, maximum or minimum values take multiple time points into account and capture their summary statistics, however, these statistics are not able to catch the detailed picture of temporal trends.
In this work, we find strong predictors with ability of capturing detailed temporal trends of variables for 30- day readmission risk and build prediction models with high accuracy.
Workflow
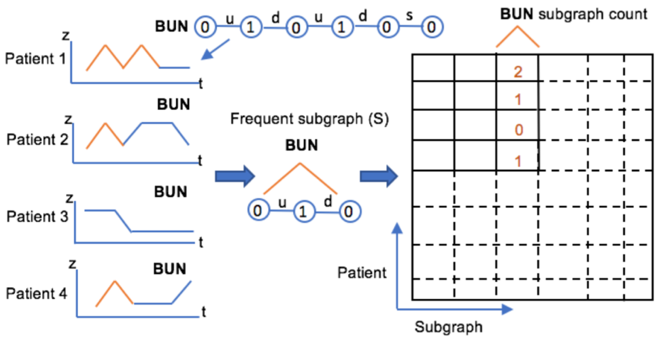
We convert patients’ time series into graphs, where each node represents a discretized measurement at a single point in time. Among these graphs, we discover the most important subgraphs and identify them as common temporal trends. We study the correlation between the important subgraphs, group them and use the groupings as an augmentation to snapshot features in building predictive models. A workflow is shown below.
Patients who are readmitted to an intensive care unit (ICU) usually have a high risk of mortality and an increased length of stay. ICU readmission risk prediction may help physicians to re-evaluate the patient’s physical conditions before patients are discharged and avoid preventable readmissions. ICU readmission prediction models are often built based on physiological variables. Intuitively, snapshot measurements, especially the last measurements, are effective predictors that are widely used by researchers. However, methods that only use snapshot measurements neglect predictive information contained in the trends of physiological and medication variables. Mean, maximum or minimum values take multiple time points into account and capture their summary statistics, however, these statistics are not able to catch the detailed picture of temporal trends.
In this work, we find strong predictors with ability of capturing detailed temporal trends of variables for 30- day readmission risk and build prediction models with high accuracy.
Workflow
We convert patients’ time series into graphs, where each node represents a discretized measurement at a single point in time. Among these graphs, we discover the most important subgraphs and identify them as common temporal trends. We study the correlation between the important subgraphs, group them and use the groupings as an augmentation to snapshot features in building predictive models. A workflow is shown below.
Study of Imputation on Temporal Data
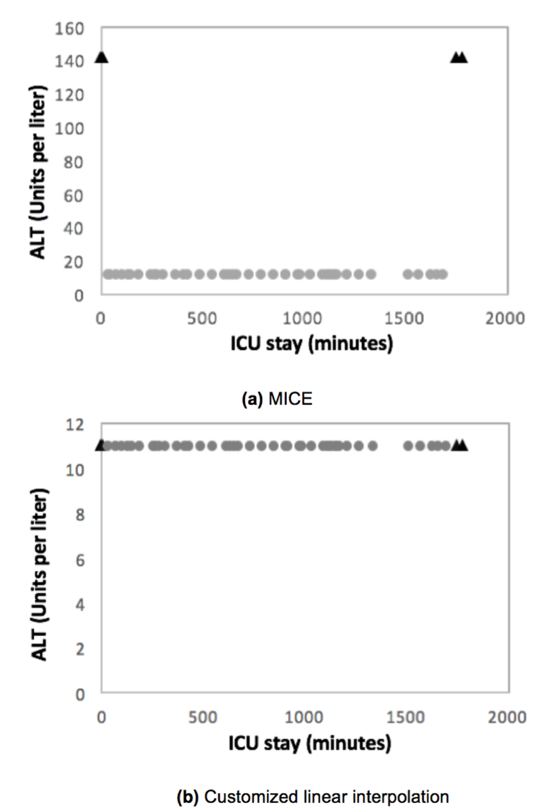
Along the way, we study the impact of different imputation techniques and develop a tailored methodology, called customized linear interpolation, that outperforms all other state-of-the-art approaches. Multivariate Imputation by Chained Equations (MICE) is a popular imputation method. However, its performance on temporal data is not as strong as that on snapshot data. A comparison between imputed values from MICE and customized linear interpolation is shown below.
Along the way, we study the impact of different imputation techniques and develop a tailored methodology, called customized linear interpolation, that outperforms all other state-of-the-art approaches. Multivariate Imputation by Chained Equations (MICE) is a popular imputation method. However, its performance on temporal data is not as strong as that on snapshot data. A comparison between imputed values from MICE and customized linear interpolation is shown below.
Conclusions
As a result, our model outperforms the baseline model that only uses the snapshot features, suggesting that the temporal trends carry predictive information for ICU readmission risk. Additionally, our experiments show that some imputation methods work well on replacing missing values in snapshot measurements but not on temporal data, suggesting that the temporal pattern need to be taken into consideration in imputation.
As a result, our model outperforms the baseline model that only uses the snapshot features, suggesting that the temporal trends carry predictive information for ICU readmission risk. Additionally, our experiments show that some imputation methods work well on replacing missing values in snapshot measurements but not on temporal data, suggesting that the temporal pattern need to be taken into consideration in imputation.
 RSS Feed